
March 19, 2025
PART TWO: INTERPRETING GWP VALUES
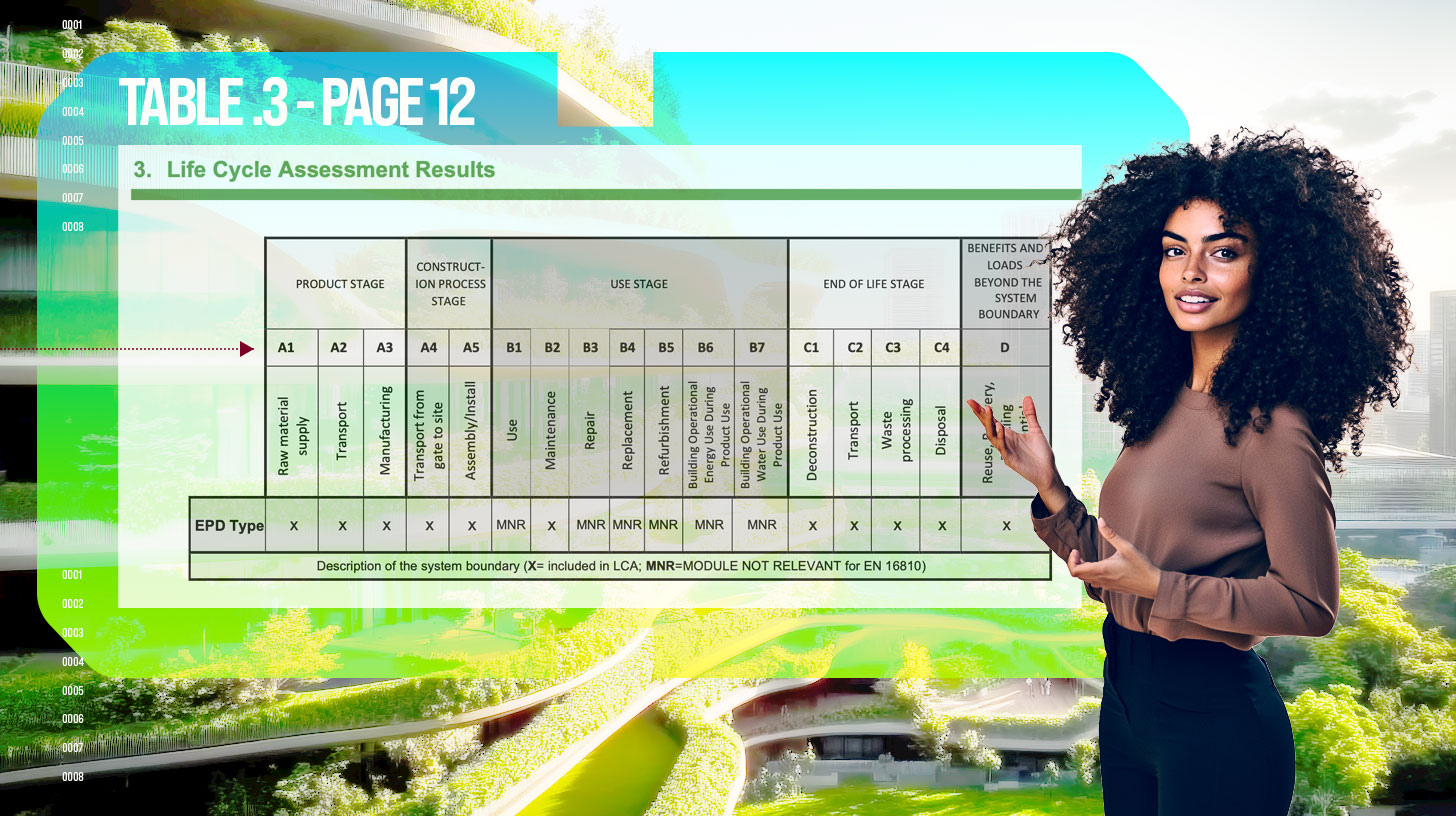
The life cycle is analyzed by dividing it into standard phases common to all EPDs:
As displayed above , the LCA monitors the product throughout its life: it starts from production (Product Stage, A1-A3) and ends with demolition (End of Life Stage, C1-C4), also providing for the possibility of reuse and recycling (D).
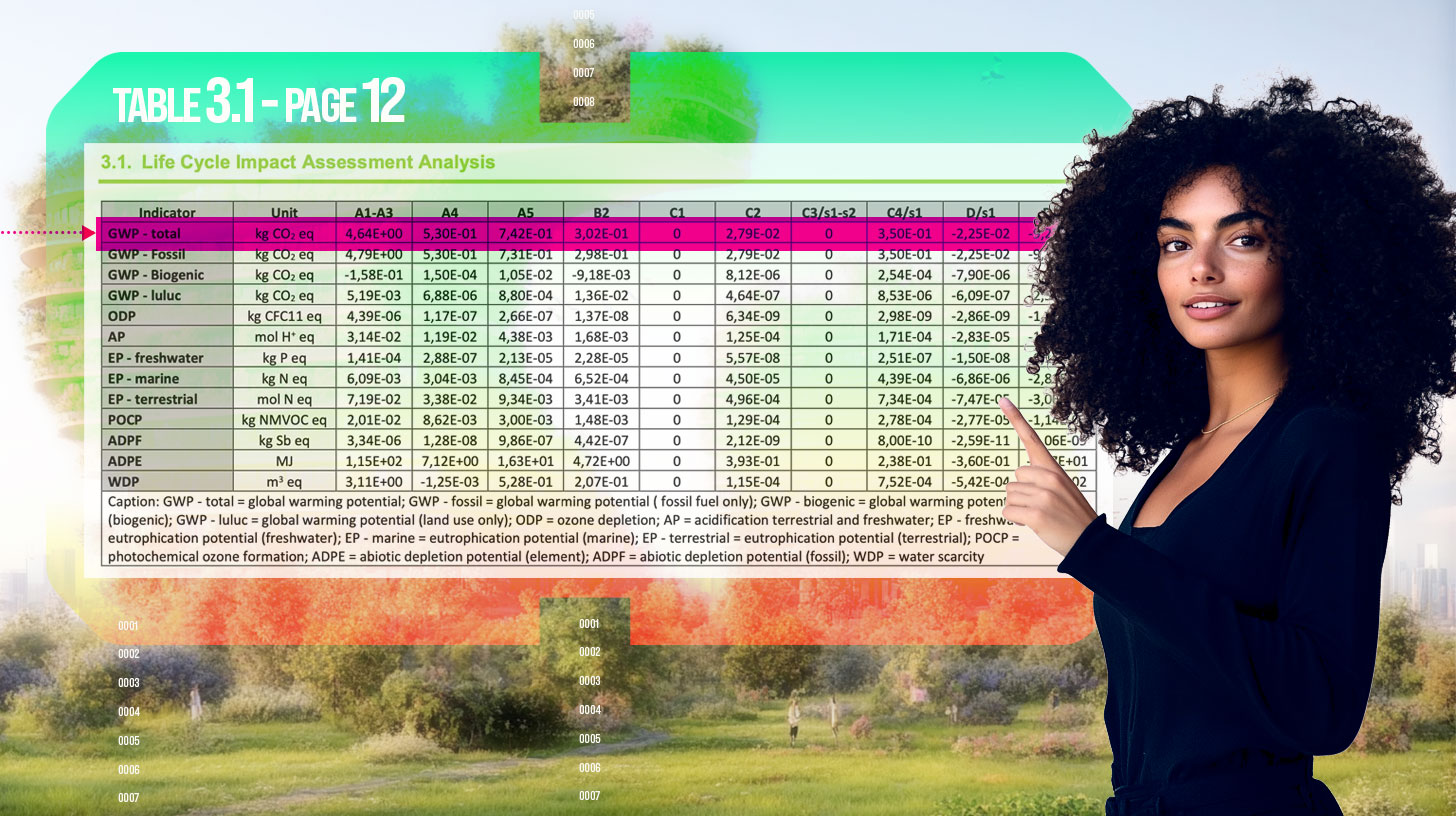
Under the section 3.1 Life Cycle Assessment Results, a Life Cycle Impact Assessment Analysis table is presented, where the “GWP – Total” data is located.
As you can see, this table shows the values of all phases of LCA, from phases A to D.
A lower GWP value indicates a lower environmental impact. For a correct comparison, it is essential to verify that the EPDs use the same calculation methodology (“PCR” or Product Category Rule) and belong to the same product category.
In technical documents, numbers can be expressed in scientific notation using the letter “E” to indicate the power of 10. The “E” stands for “exponent” and represents the multiplication by a power of ten. For example:
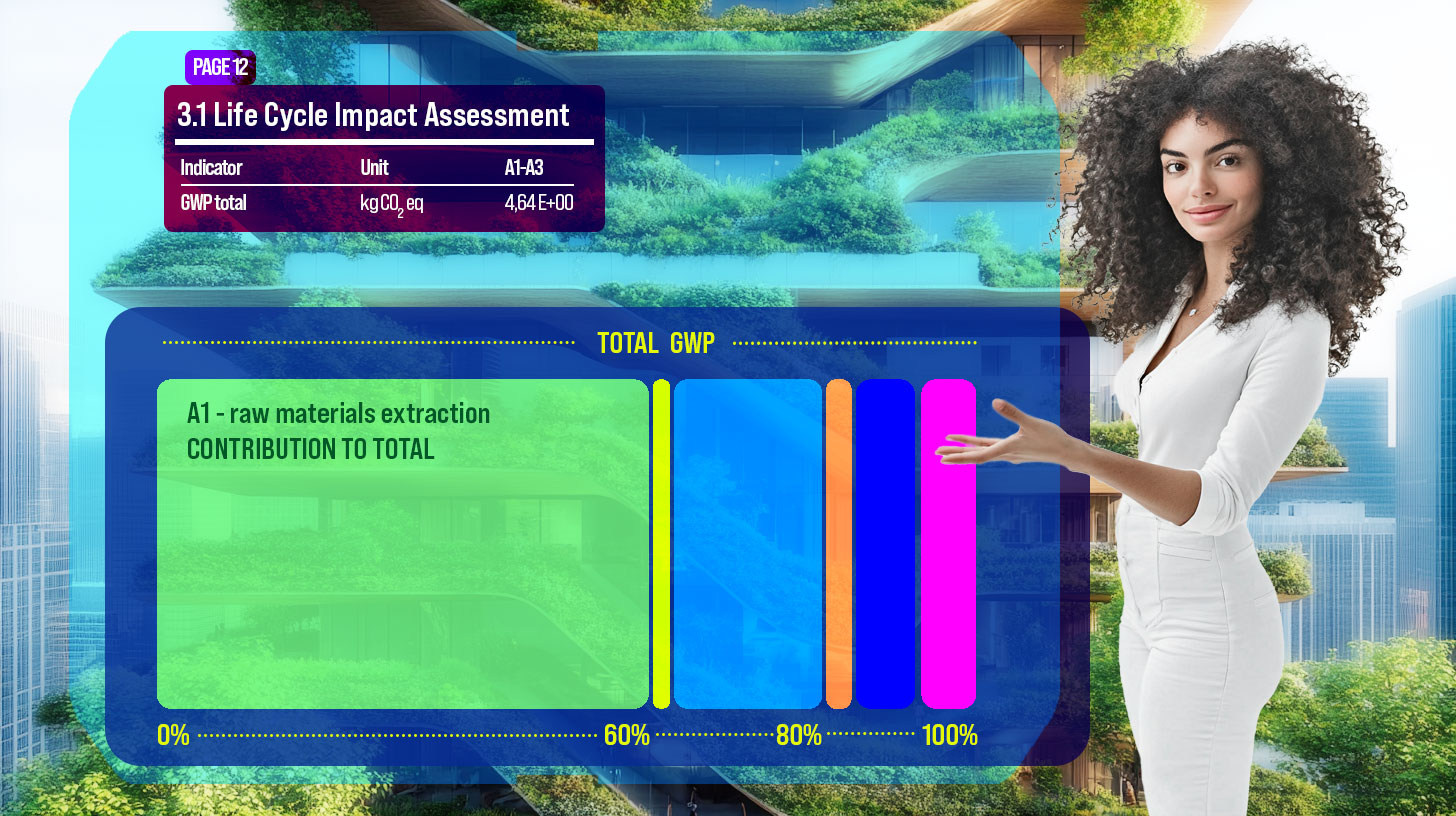
The best way to perform product-to-product comparisons is by examining its Cradle to Gate values (A1-A3 or “Product Stage”).
What does Cradle to Gate include:
A1, Raw Material Extraction, is typically the biggest contributor to GWP. Below, is a graphic representation of A1 for 3 mm Uni and Kayar, from the GAIA EPD.
"*" indicates required fields